
What Is So Bad About Retail Analytics Software?

What if something suddenly appears in the road ahead?
Reactions can be a good thing when the reaction prevents further damage. A bicyclist needs to react when a rabbit runs across the road and the reaction needs to be both immediate and appropriate. Not reacting immediately means the cyclist hits the rabbit but not reacting appropriately can result in the cyclist hitting the pavement. But if that cyclist had not been proactive in their analysis of the situation, they would not have been prepared to act immediately or appropriately. Cyclists in heavy traffic must analyze an ever-changing situation that has more potential for damage than a single rabbit can cause. Retail analytics has the same dynamics as a cyclist navigating heavy traffic.
Proactive Analytics
The cyclist has to be aware of what is happening around them and realize that any driver in the vicinity can change conditions immediately. Retailers don’t usually need to respond quite as fast as a cyclist in heavy traffic but they do need an equal awareness of the variables of the supply chain and consumer behavior and much more.
ChainDrive Retail Analytics enables limitless reports that integrate real-time status with historical information. That means you can get the information you need in time to adjust your strategies for the conditions ahead. If key performance indicators are revealing lowered sales, you can look into what could be happening in that particular location. Since you have all your data in ChainDrive’s centralized database and the ability to use sophisticated data mining techniques, you can easily isolate factors that apply.
Retail Analytics Software Appropriate Response
The cyclist who only sees the pavement in front of their wheel can overreact when suddenly there is a problem. The retailer needs to see more than one thing at a time or their response is equally inappropriate. For example, holding all stores to the same KPI of sales or units per hour ignores the variables caused by being in different locations. A store in a quiet area will struggle to meet the same KPI as the store in a busy shopping zone. Staff members who have struggled to come close to the unrealistic KPI are discouraged and give up when the KPI is raised “to encourage them to strive harder” in a sales environment that has lower traffic.
ChainDrive Retail Analytics software gives you the ability to view your data in the level of detail and width of scope necessary to respond appropriately instead of reacting in a way that causes more harm.


1 Response
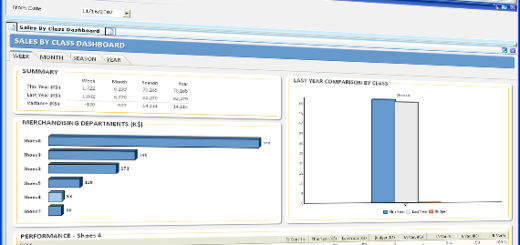
[…] Analytics software needs to have user-definable data views so that key information is isolated and seen in ways that make sense to the viewer. Not everyone likes spreadsheets, so there needs to be a variety of methods to communicate. Dashboards, graphs, pivots, drillable lists, etc. each are useful tools to bring everyone in the meeting to a good understanding of the facts. […]